Introduction to CX Dashboard
The Sogolytics CX solution offers a powerful Dashboard designed to help you easily follow customer satisfaction trends and identify potential customer experience issues across the customer journey. The Dashboard gives you a bird’s eye view of your data so you can track real-time trends.
Here’s what you can see on the CX Dashboard:
Dashboard Overview
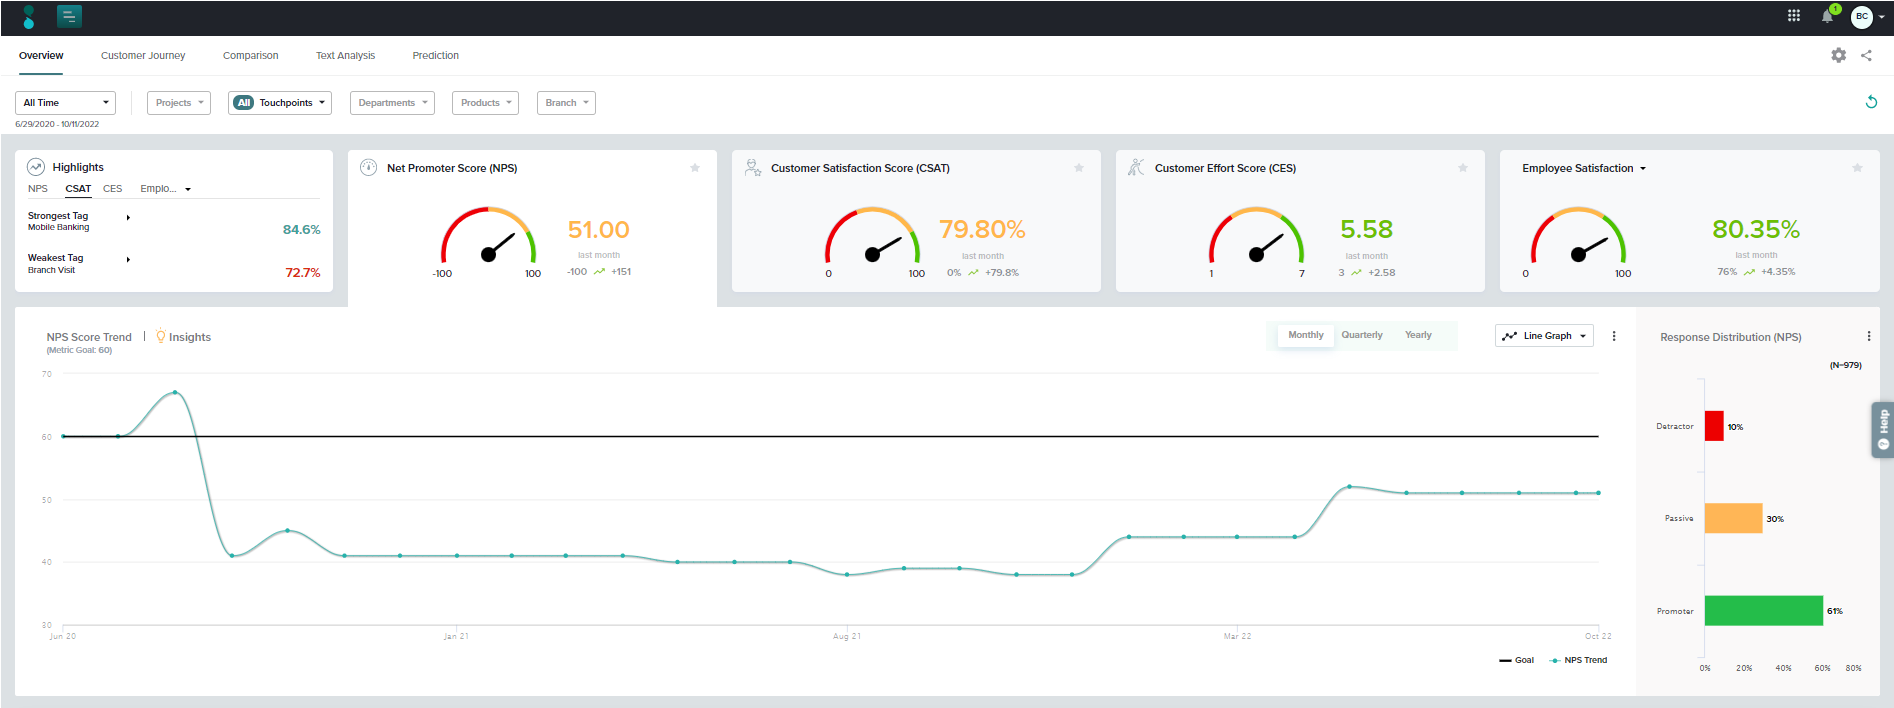
We provide three customer care metrics – NPS, CSAT, and CES – that offer a solid foundation for your CX study, but you may also create custom metrics to measure key elements specific to the experience of your own customers. By gathering and acting on this valuable feedback, you will be able to attract more customers, satisfy and retain existing customers, and make impactful moves right away and down the road.
The Dashboard Overview allows you to view key metric scores associated with all or selected Tags.
For a deeper understanding of what’s impacting the performance of your CX metrics across Tags, view the Insights section and drill down on key drivers. Understand which drivers matter the most to your customers and track their performance over time.
Learn more about the data analyzed under the Overview tab in the CX Dashboard.
Customer Journey
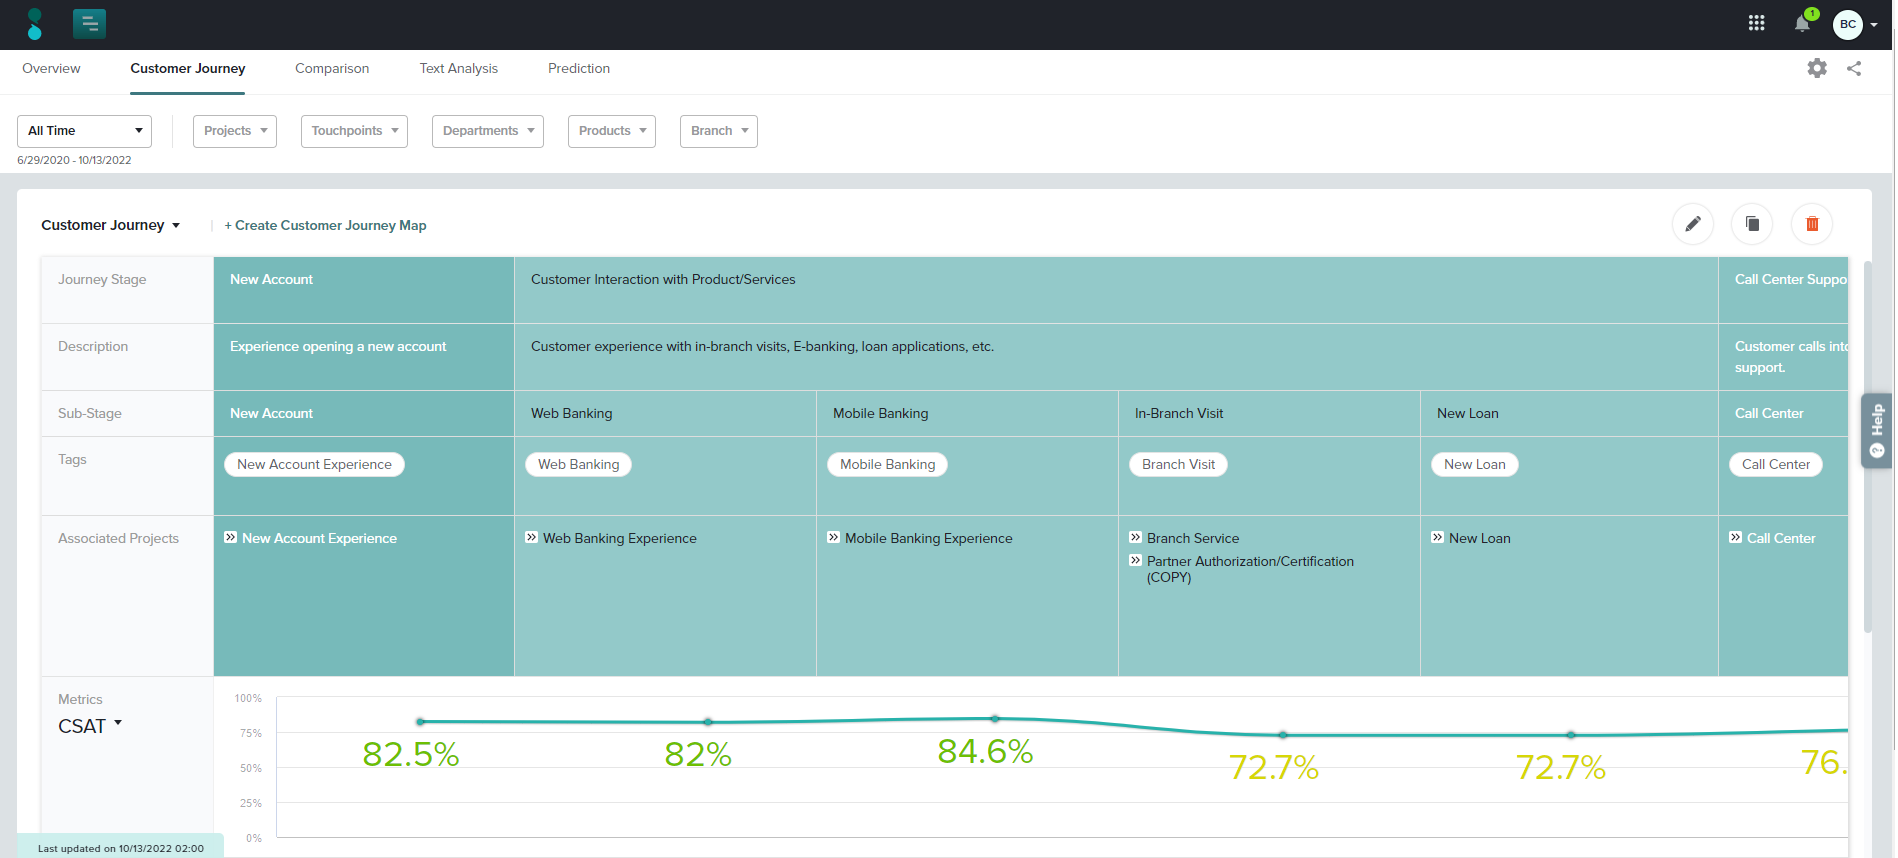
This portion of the Dashboard helps you to map the satisfaction (and other metrics!) of your customers through various stages of their experiences with you. Drill down even more closely to view sub-stages, tracking experience across as many projects as needed. In the big picture, you may create multiple journeys for different groups of customers (those with home loans, those with checking accounts, etc.).
Comparison
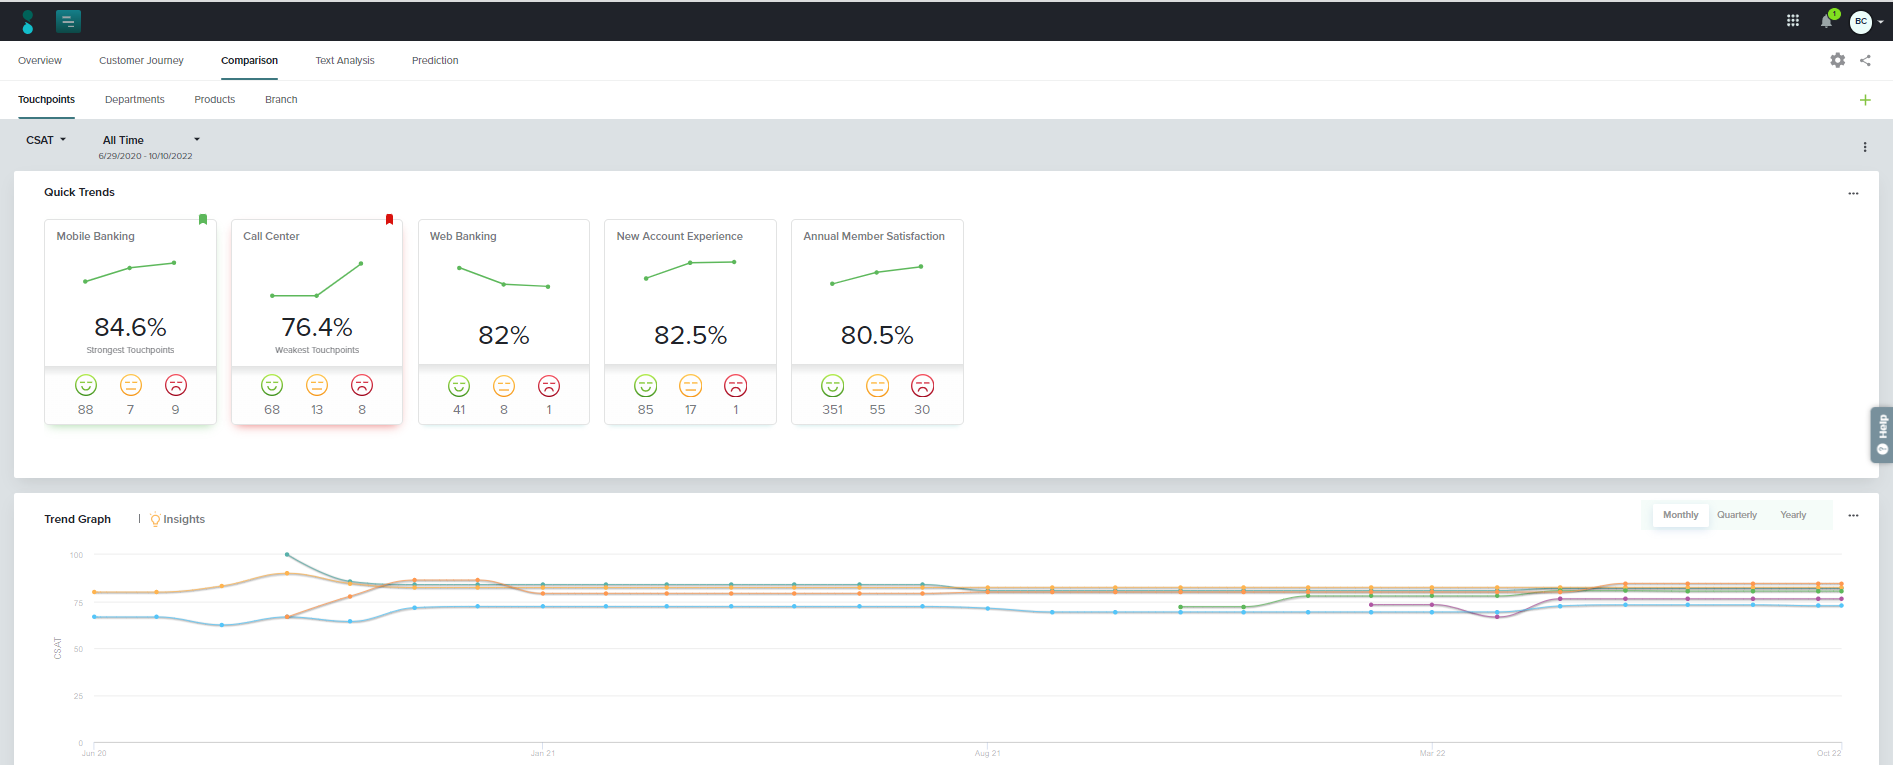
Compare Tags within a single category or create your own comparison data sets. Compare scores and trends of different Tags across critical time periods.
To keep your team informed, it’s easy to share the Dashboard with a dynamic link that updates as responses are received.
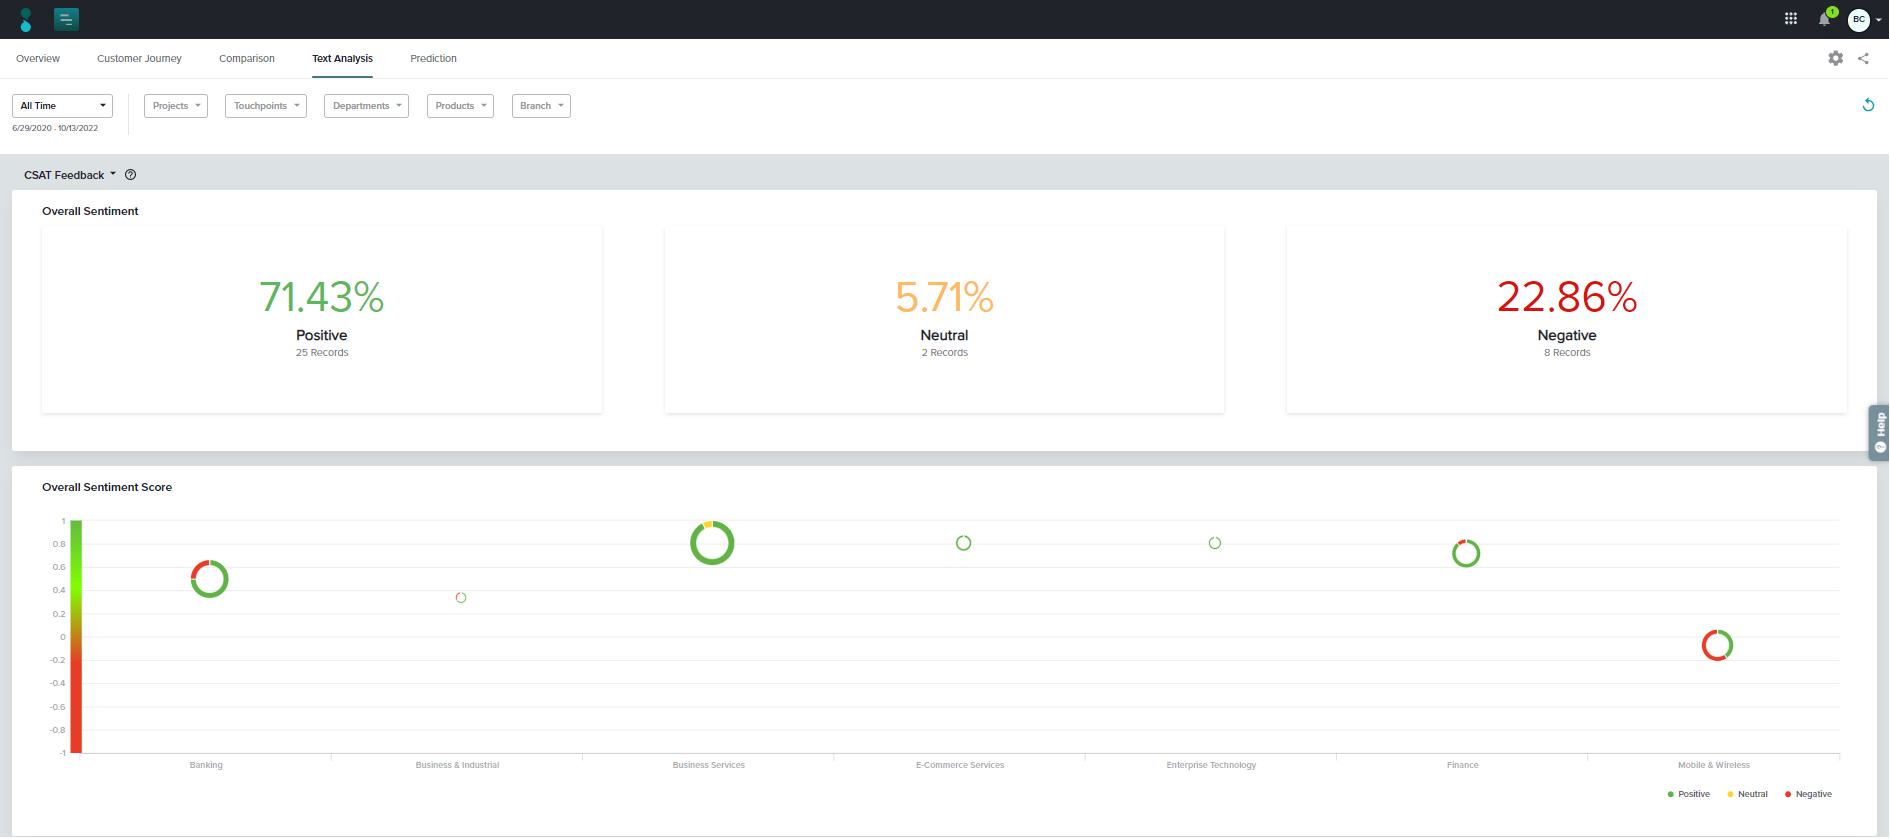
Text Analysis
Gauge the sentiments of customers’ open-ended responses, including Overall sentiment, sentiment graph, weekly sentiment score, and more. This section of the Dashboards analyzes content only from CX metric follow-up questions, so you can be sure that these are the most relevant explanations for the ratings displayed throughout the Dashboard.
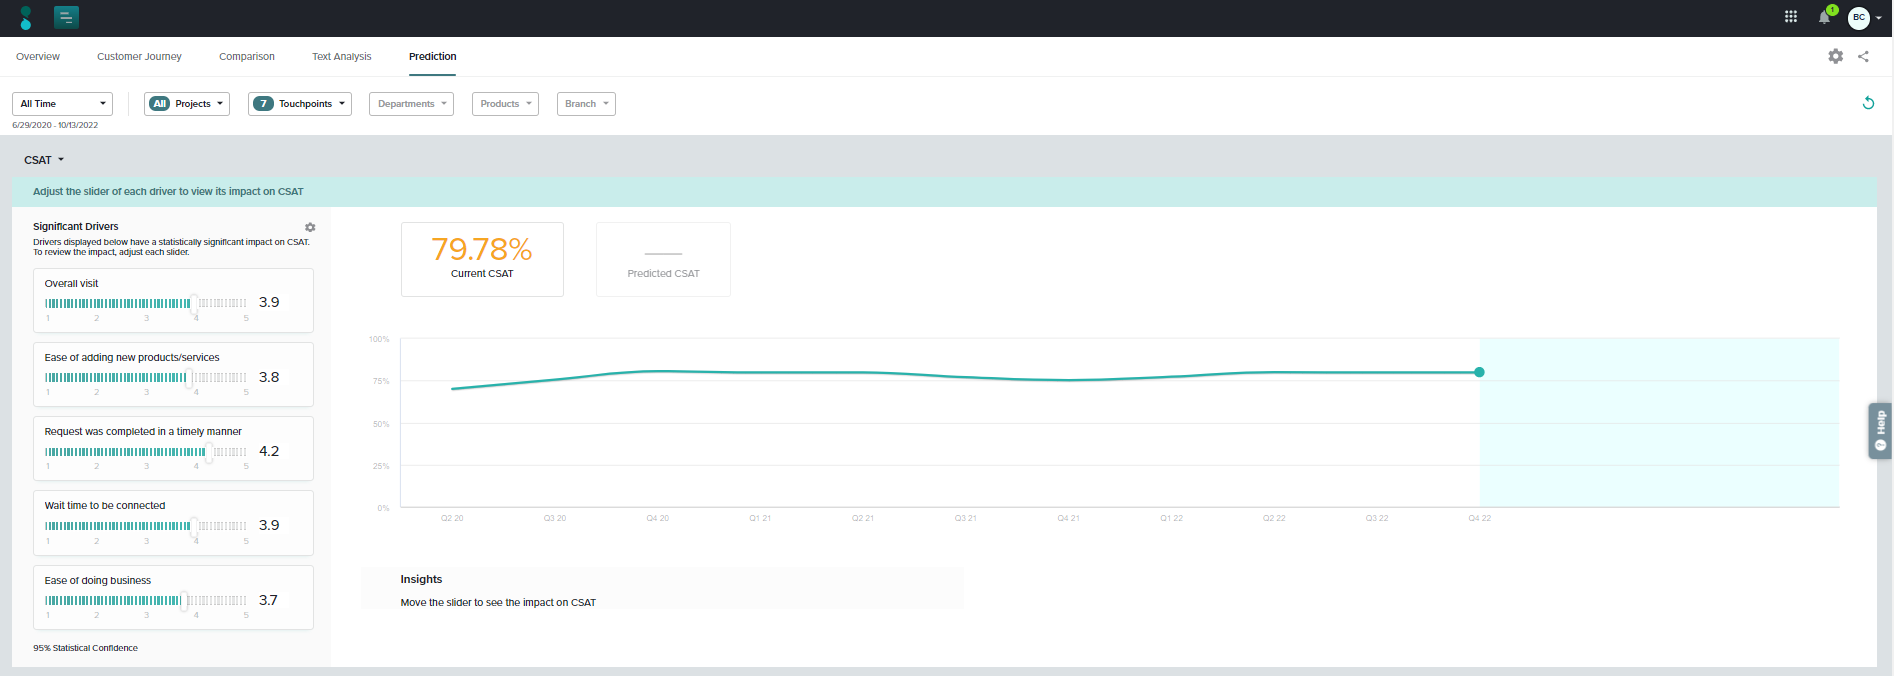
Prediction
Wondering where your time and resources can have the greatest impact? Predictive analysis allows you to test how improvements (or downgrades!) in statistically significant key drivers can impact your most important CX metrics.
