

Recent Projects
Easily return to projects you’ve been working on by accessing Recent Projects from the Home screen. Here, you can review key stats or take quick action.
Here’s what you’ll see:

- Status: The colored icon in front of the project title indicates its status.
- Orange: Indicates Edit mode, meaning the project has not yet been published.
- Green: Indicates Active mode, meaning the project has been published and can receive responses.
- Red: Expired mode, meaning that the project is closed and can no longer receive responses.
- Estimated completion time: Since shorter questionnaires deliver better response rates, keep track of how long it will likely take for participants to finish. The time provided here is an estimate, but do your best to keep this number low.
- Last accessed: The time and date displayed in the bottom left corner of the tile indicates when your project was last updated.
- Total responses: The number in the bottom right of the tile is the total count of responses received for this project.
- Project Type: Identify your project type by the colored tag on each card.
Ready to take action? Just hover over the right project tile and choose your next step.
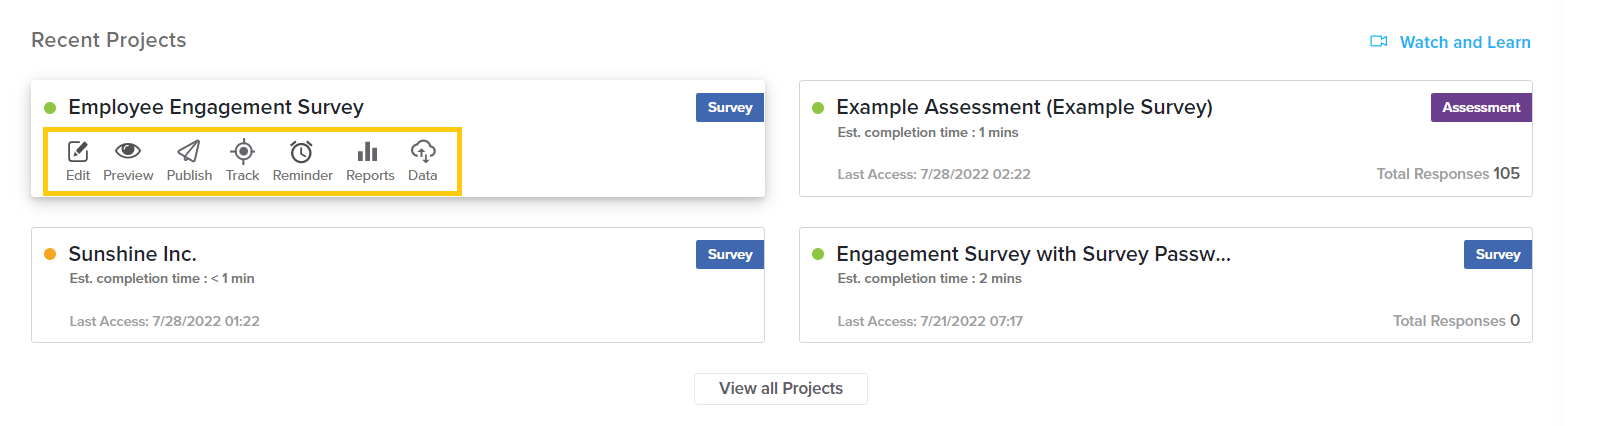
- Edit: Modify your project as needed by clicking on the pencil icon on the left.
- Preview: Click the eye icon for a quick look at this project from a participant’s view.
- Publish: Click this icon to quickly distribute a project. If the project is expired, this option will not be displayed.
- Track: Once you’ve published your project, click this icon to track participation across channels.
- Reminder: If you’ve sent invitations but you’re still waiting on responses, click this icon to send Reminders to those who haven’t yet replied.
- Reports: If the project has already received responses, click the graph icon to generate reports.
- Data: Click this icon to import data into your project or export data into multiple formats.
- Dashboard: If you are building a CX project, you can directly access the relevant Dashboard by clicking on this icon.
