

Save, Share and Slideshow
Save Report
When you’re looking at the same data from different angles, save multiple instances of your Omni Report for easy access in the future.
Here’s how:
- Select your project, then click on Report to view the default Omni Report.
- Make any changes to the report that you would like to save.
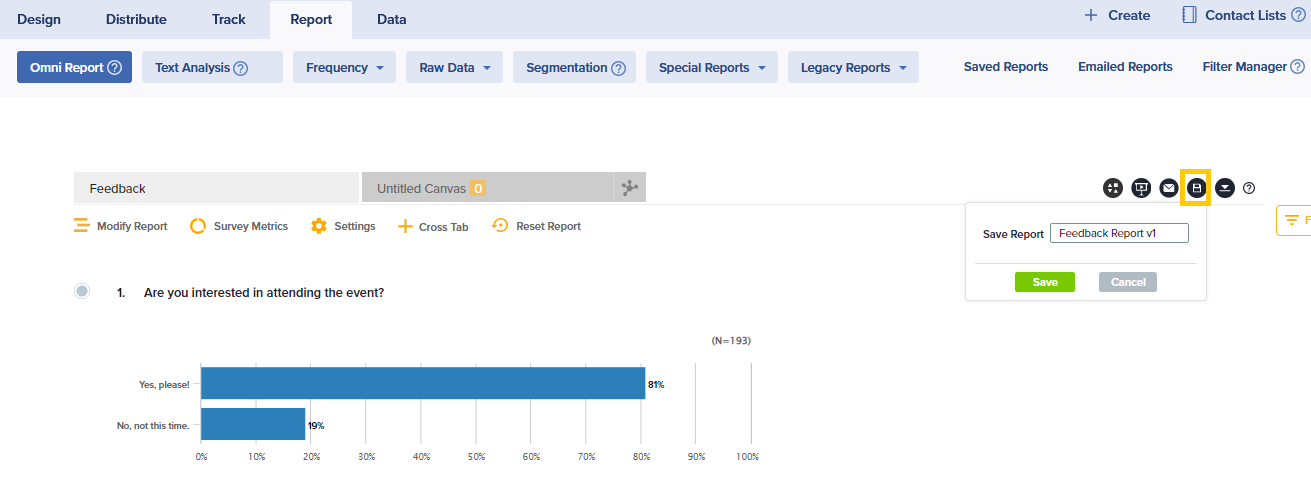
- Click on the save icon at the top of the report.
- Enter a unique name for your saved report.
- Access these saved versions of the report under Saved Report in the Report menu bar.
Share Report
Sogolytics allows you to share reports that are dynamic in nature. While those age-old static reports have their place offline, dynamic reports let you enjoy all the latest responses every time you open the report.

Here’s how:
- To share your report via email, click on the email icon at the top of the default report page.
- Fill in the following details:
- Report Title: Enter a unique title for your report.
- Sender Name: Enter the sender’s name. By default, this value will be the name on the account.
- Sender Email: By default, this address will use Sogolytics mail servers. We recommend you use this default address, as editing this field may cause delivery issues or classification as spam. To change the Sender Email, you will need to verify your email address.
- Subject: Add a subject line that is clear and simple. The maximum character limit for this field is 250. By default, you’ll see Invitation to view Omni Report.
- To: Enter up to 10 email addresses(separated by commas) that should receive the report canvas.
- Choose whether to:
- Add a logo to the email content
- Allow recipients to download results
- Allow recipients to drill down to individual response
- Allow recipients to use saved filters to review results
- Choose Customize filtering options to limit recipients’ filtering capabilities.
- Enter any content that should be included.
- Choose when to expire the report link delivered. By default, all emailed reports are set to expire in 30 days.
- Apply any required color customization.
- Click Continue, preview the email, and send!
Report Slideshow
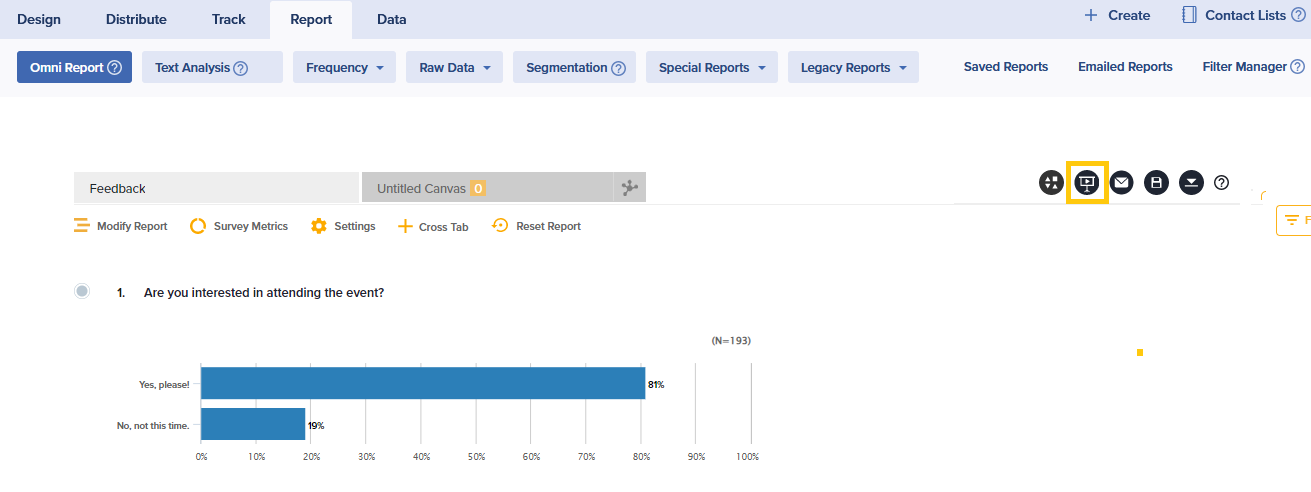
To showcase your report findings, consider a slideshow view. On the default report page, click on the slideshow icon in the top right.
Based on your display resolution or browser zoom, you may see a 3-dot icon on the far right of the Report menu bar. Click here to access Saved Reports, Emailed Reports, and Filter Manager.
